Concept & design choices
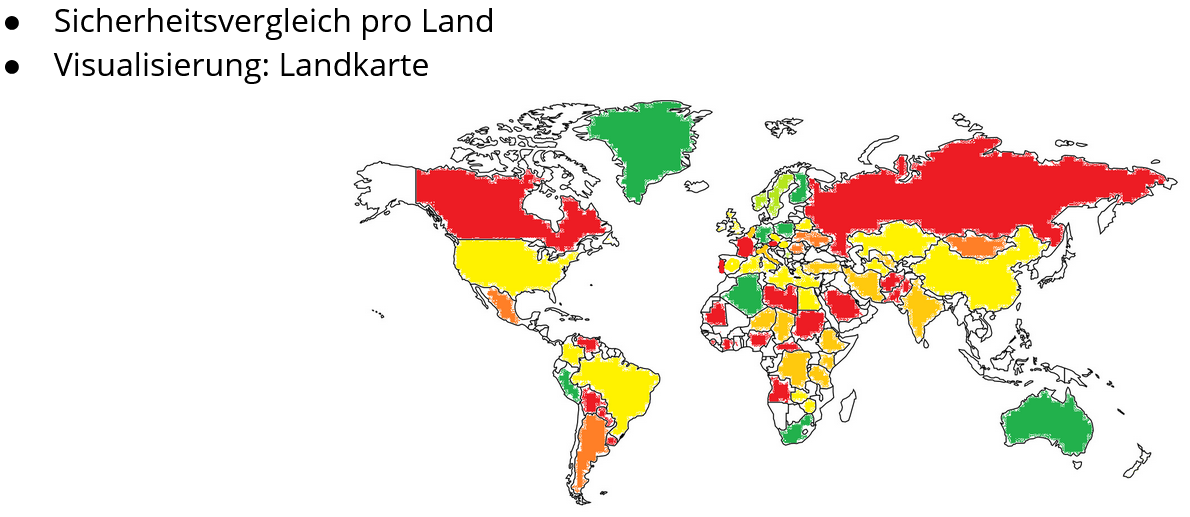
The initial concept for this visualization was quite challenging and we had to apply some changes to it.Wold map
In our concept we wanted to visualize the security score by coloring the countries on the map. However, this creates a distorted picture of the real situation because bigger countries are perceived as more significant as small countries.The values are mapped and normalized by using the security score. The were no visual variables used in the map, with the intention to encourage the readers to explore the map. Tuftes data-ink-ratio is not as high as it it would be in other charts. While a single country represents mutiple values, there is still a lot of space which is only used as geographical context. To easily distinguish countrys, while not having any geographical knowledge, a hover effect which shows the countrys name is implemented.
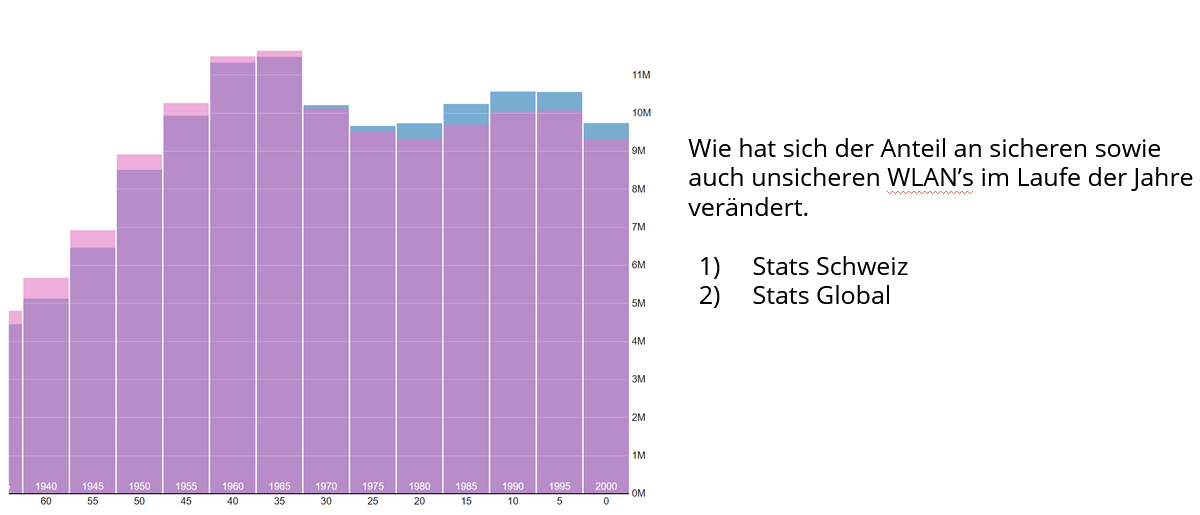
Timeline (changed to country comparison)
There is no API endpoint that allows to check for different years on wigle.net. Therefore we couldn't realize this idea. Instead of creating a timeline, we created a comparison of all countries by our security score in a bar chart. This chart makes it simpler to compare the scores of the different countries.The length acts as a visual variable to distinguish the countrys with a low security score from the countrys with a high security score. Additionaly a hover effect which shows the countrys name and security score was implemented. The data-ink-ratio is as minimal as possible and conforms perfectly to tuftes principals. Since this is a simple and easy to understand chart, we did not provide any view manipulations.
Brand influence cartogram
Unfortunately D3.js doesn't provide a simple way to create cartograms like the ones on worldmapper.org. There are examples of cartograms for D3.js but they are not well documented and therefore we couldn't find a way to make it work.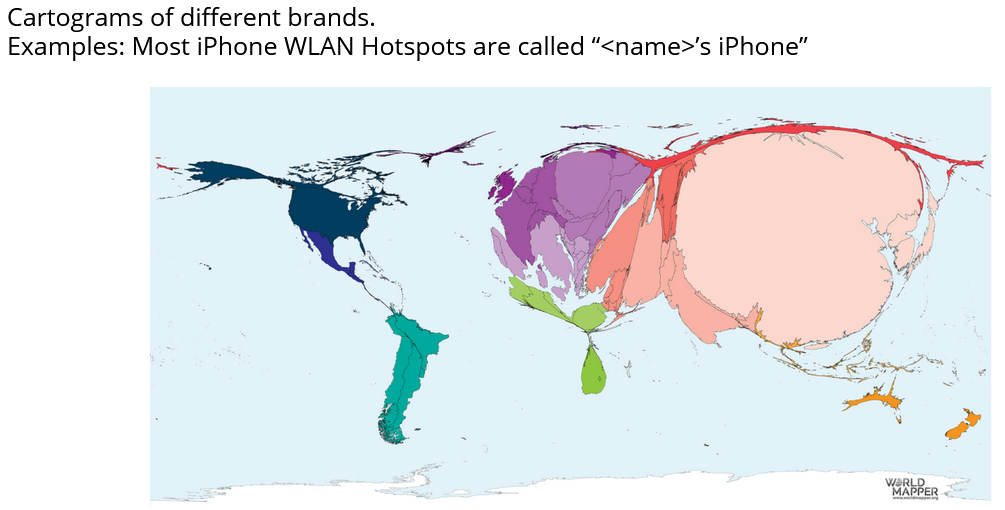 Image source: worldmapper.org
Switzerland
The wigle.net regions API endpoint https://api.wigle.net/api/v2/stats/regions?country=CH provides the number of access points for each region/canton. But there is no way to get information about the security for the regions. Security information is only provided on country level. With this information a map only for switzerland wouldn't make sense.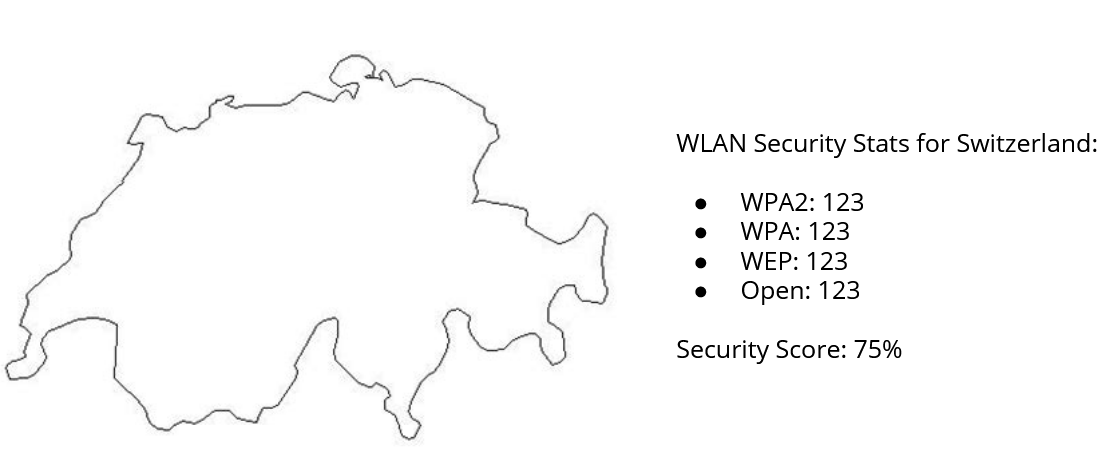
Insight
Surprisingly, access points around the world are usually well secured. There are very few who do not protect themselves sufficiently.But it is noticeable that especially in countries where we have only little data, high security scores have always been achieved.
These countries also have a very high number of access points with unknown encryption.
We assume that these are not sufficiently protected, but we cannot prove this. Therefore we have omitted them when calculating the security score.
In general, however, we can say that people usually protect themselves well enough and can certainly choose the right encryption with the support of the Internet.